
The fastest, highest-impact move in industrial painting workflow optimization is a focused paint-efficiency audit. Run it first, before buying any equipment. Target mixing, transfer efficiency, and booth uptime in that order, and you will expose the waste that costs the most.
Here is where to start:
- Run a one-shift audit. Map your value stream, time every stage, and flag where WIP piles up or rework spikes.
- Fix proportioning first. Manual pressure-pot mixing is the single largest source of material waste in most facilities.
- Check gun setup before anything else in application. Fluid tip size, air cap, and gun-to-part distance account for most transfer-efficiency losses.
- Tighten booth maintenance. Worn seals, clogged filters, and dirty lighting cause more contamination rejects than most managers realize.
- Write SOPs before you buy hardware. Operator technique and documented procedures deliver faster payback than capital equipment in most paint lines.
Key Takeaways
A disciplined audit-first approach to industrial painting workflow optimization consistently outperforms equipment-first spending, with the largest gains coming from proportioning, gun setup, and booth maintenance before any capital automation.
| Point | Details |
|---|---|
| Audit before you spend | Run a VSM-based paint-efficiency audit to identify your highest-impact weak points before committing capital. |
| Proportioning cuts the most waste | Moving from pressure-pot mixing to point-of-use plural-component systems reduces flush waste, rejects, and color-change time. |
| Operator technique is the fastest lever | Standardizing gun-to-part distance, stroke overlap, and trigger timing delivers transfer-efficiency gains with no capital outlay. |
| Booth maintenance prevents rework | A daily/weekly/monthly filter and seal schedule eliminates most contamination-related rejects and unplanned downtime. |
| Dustfreefilm reduces changeover contamination | Multi-layer electrostatic booth films remove accumulated overspray during changeovers, cutting dust-related rejects as a measurable pilot metric. |
Table of Contents
- How do you run a focused paint-efficiency audit?
- How does point-of-use proportioning cut waste in the paint kitchen?
- Which equipment changes improve application transfer efficiency most?
- How do booth maintenance and airflow control reduce unplanned downtime?
- How do you design a pilot and measure ROI in a painting operation?
- SOPs, training, and operator competency: how do you make gains stick?
- What does the research say about expected improvements?
- What does a 90-day implementation plan look like?
- The case for process-first, technology-second
- Dustfreefilm fits directly into your booth-contamination reduction plan
- Sources
How do you run a focused paint-efficiency audit?
Value Stream Mapping (VSM) is the right tool here. It is the industry-standard method for visualizing every step in a production process, timing it, and identifying where value is added versus where time and material are simply lost. A PLOS ONE case study applying VSM and ECRS-style changes to an automotive painting line produced measurable increases in value-added operation time and reductions in non-value-added time, with additional gains in scrap reduction.
You can complete a useful audit in a single shift if you stay focused.
Audit checklist: what to collect
- Cycle time per station (from first touch to part-out)
- Lead time end-to-end (order release to final inspection)
- WIP count at each handoff point
- Changeover time (color-to-color, product-to-product)
- Transfer efficiency proxy: material consumed per unit versus theoretical coverage
- Rework rate: parts returned for recoat or repair, by station
- Material use per unit: gallons or liters consumed per part or batch
- Downtime minutes per shift, by cause
How to map the value stream for a paint line
- Walk the line from raw part to finished part. Draw every step, including waits, inspections, and moves.
- Record cycle time and WIP at each station. Mark which steps add value and which do not.
- Identify bottlenecks: where does WIP accumulate? Where does the line stop waiting?
- Flag rework loops: parts that leave the line and return add lead time and consume material twice.
- Note changeover sequences: long color changes often hide in plain sight as “normal” downtime.
Prioritizing weak points
Plot each finding on a simple impact-versus-effort matrix. High impact, low effort items go first: gun setup corrections, SOP updates, and filter replacements. High impact, high effort items (proportioner installation, robotic applicators) go into a capital plan with an ROI model. Low impact items get deprioritized.
Pro Tip: *Bring a stopwatch and a clipboard, not a spreadsheet. Time every step yourself on the shop floor.
How does point-of-use proportioning cut waste in the paint kitchen?
Manual pressure-pot mixing is where most facilities bleed material cost. Batches are mixed in larger volumes than needed, viscosity drifts during long jobs, and flush waste accumulates with every color change. Point-of-use plural-component positive-displacement proportioning solves all three problems at once.
Why it works
Near-applicator mixing means you mix only what you spray. There is no leftover pot waste at the end of a job, viscosity stays consistent because the ratio is metered electronically, and color changes require flushing only the short line between the mix point and the gun rather than the entire pot and feed system. Graco’s ROI guidance for plural-component systems identifies mix-point proximity, reduced flush waste, and faster color changes as the three primary ROI drivers.
Operational benefits at a glance
- Less flush solvent consumed per color change
- Fewer rejects from off-ratio mixing errors
- Faster color changeovers (shorter flush lines)
- Consistent viscosity through long production runs
- Reduced VOC emissions from lower solvent use
Implementation considerations
Pneumatic-drive systems are the most common entry point for smaller facilities: lower installation cost, no electrical infrastructure changes, and straightforward maintenance. Hydraulic and electric-drive systems handle higher flow rates and offer tighter ratio accuracy for demanding two- and three-component coatings. Placement matters: the closer the mix point is to the applicator, the shorter the flush line and the lower the waste.
Plan for a maintenance window during installation. Most proportioner retrofits require one to three days of line downtime depending on existing plumbing and electrical layouts.
Building a simple ROI estimate
Model these inputs:
- Material cost per gallon (base coat, hardener, reducer)
- Number of color changes per shift
- Flush volume per color change (current vs. projected with near-applicator mixing)
- Reject rate tied to off-ratio batches
- Labor time for manual mixing versus automated proportioning
A Graco ProMix PD case study documents a finisher’s move from pressure-pot mixing to a three-component ProMix PD system, reporting measurable monthly material savings and a multi-month payback on the installed system. That is a useful benchmark when building your own model.
Two systems worth evaluating in vendor conversations: the Graco ProMix PD (positive-displacement, suited to two- and three-component coatings with tight ratio requirements) and the Graco ProMix 2KS (electronic proportioner for two-component systems, designed for near-gun placement). Neither is the only option on the market, but both have documented field deployments and published case data, which makes them useful reference points in an RFP.
Pro Tip: During any proportioner pilot, track flush solvent consumption by weight before and after. It is the fastest, most concrete number to put in front of a finance team.
Which equipment changes improve application transfer efficiency most?
Transfer efficiency is the percentage of paint that actually lands on the part. The rest goes to overspray, booth filters, and the floor. Improving it is the most direct way to cut material cost and reduce VOC emissions simultaneously.
Atomizing technology options
- HVLP (High Volume Low Pressure): Best for complex geometries and detailed work. Transfer efficiency typically runs higher than conventional air spray. Slower application speed.
- Air-assisted airless: Higher throughput than HVLP, good for flat or simple geometry. Less sensitive to operator distance variation.
- Electrostatic: Wraps coating around part edges and recesses. Highest transfer efficiency for conductive parts. Requires grounding and more operator training.
- Airless: Fastest application, lowest transfer efficiency. Best for high-build coatings on large flat surfaces where speed matters more than material savings.
Gun setup checklist
- Fluid tip sized to the coating viscosity and flow rate required
- Air cap matched to the fluid tip (mismatched pairs are common and costly)
- Inlet pressure set at the gun, not just at the pump
- Fan pattern sized to part width (oversized patterns waste material on edges)
- Trigger pull and fluid needle adjusted for clean cutoff
Operator technique: the most under-invested lever
Gun-to-part distance, stroke overlap, and trigger timing account for a large share of transfer-efficiency variance between operators on the same equipment. Small, repeatable changes in gun handling frequently outperform equipment upgrades when volume and part geometry allow.
When to consider robotic applicators
Robotic applicators make sense on high-volume lines with low geometry variance: structural components, flat panels, cylindrical parts. The consistency gain is real, but the upfront cost and programming time are significant. A simulation study on AGV use in painting workstations found that deck-lift AGVs in dedicated painting stations reduced waiting time and lead time in modeled configurations, which points to automation as a meaningful lever where layout and part flow permit.
Pro Tip: Validate transfer-efficiency gains with a simple weigh-test: weigh the part before and after coating, then compare to the theoretical coverage from the product data sheet. Run it on three operators with the same gun setup. The spread tells you exactly how much technique variance you are carrying.
How do booth maintenance and airflow control reduce unplanned downtime?
Contamination-related rework and unplanned booth downtime are almost always preventable. The root causes are predictable: clogged filters, worn door seals, dirty lighting, and inconsistent compressed-air quality. A structured preventive maintenance schedule eliminates most of them.
Daily / weekly / monthly maintenance checklist
Daily:
- Inspect intake and exhaust filters for loading; replace when pressure drop exceeds spec
- Check door and window seals for gaps or tears
- Verify compressed-air dryer function and drain moisture traps
- Clean lighting fixtures (dust on lights falls directly onto wet parts)
- Inspect floor condition and remove overspray buildup
Weekly:
- Check conveyor or part-hanger systems for contamination transfer
- Verify airflow velocity at the booth face (measure with an anemometer)
- Inspect spray gun filters and fluid lines for partial blockages
- Review downtime log for recurring causes
Monthly:
- Full filter replacement per manufacturer schedule or measured pressure drop
- Inspect booth walls and ceiling for overspray buildup that can flake
- Check and calibrate booth temperature and humidity controls
- Verify exhaust fan belt tension and motor condition
Airflow and filtration best practices
Booth airflow should move from clean to dirty: intake at the ceiling or front, exhaust at the floor or rear. Cross-drafts from open doors or gaps in seals disrupt this pattern and carry contamination directly onto wet parts. Maintaining the correct face velocity (typically 100 feet per minute for downdraft booths) keeps overspray suspended and moving toward exhaust filters rather than settling on surfaces. SSPC-PA 1 provides application and pre-application requirements that should inform your inspection hold points and environmental condition checks.
Quantifying the cost of downtime
Calculate your booth’s hourly production value: parts per hour multiplied by the margin per part. A booth running at $400/hour in throughput value that loses four hours per week to contamination rework costs over $80,000 per year in lost output. That number makes filter replacement schedules and seal inspections easy to justify.
Pro Tip: Standardize your spare-parts inventory for the three most common failure points in your booth: intake filters, exhaust filters, and door seals. Keep two sets of each on the shelf. The cost is trivial compared to a four-hour unplanned shutdown.
- Document every downtime event with cause, duration, and corrective action.
- Review the log monthly and identify the top three recurring causes.
- Build a preventive action for each into the weekly or monthly checklist.
- Assign ownership to a named maintenance lead, not a team.
How do you design a pilot and measure ROI in a painting operation?
A pilot that runs too long or measures too many things produces inconclusive data. Keep it tight: one intervention, one line, four to six weeks.
Recommended pilot scope
Start with the highest-impact, lowest-complexity finding from your audit. For most facilities, that is either gun setup standardization or a proportioner trial on one color. Run it on a single line or shift so you have a clean control comparison.
Core KPIs to track
- Material usage per unit (gallons or ounces consumed per part)
- Rework rate (parts requiring recoat, by cause)
- Cycle time per station
- Changeover minutes (color-to-color)
- Downtime minutes per shift, by cause
- Labor minutes per unit
ROI calculation template
Multiply the delta in material cost per unit by your monthly production volume to get monthly savings. Add labor savings. Divide total capital cost by monthly savings to get payback in months. Graco’s automation ROI tools provide a structured framework for modeling these inputs against equipment costs.
Go/no-go criteria
Define success before the pilot starts. If the pilot hits two of three, scale up. If it misses all three, the intervention is wrong or the baseline data was inaccurate.
SOPs, training, and operator competency: how do you make gains stick?
Equipment upgrades and process changes revert to old habits within weeks if SOPs are not updated and operators are not trained to the new standard. This is where most optimization programs fail.
Converting audit findings into SOPs
Every weak point the audit identifies should produce one updated SOP or checklist. Keep them short: one page, with photos or diagrams where possible. Post them at the station, not in a binder. Industrial painting best practices require that SOPs cover application sequence, gun setup parameters, environmental condition checks, and inspection hold points per SSPC-PA 1 guidance.
Competency matrix
| Role | Skill | Certification frequency | Scoring method |
|---|---|---|---|
| Spray operator | Gun setup and technique | Every 6 months | Observed checklist, pass/fail |
| Spray operator | Proportioner operation | At installation + annually | Written + practical |
| Maintenance lead | Filter and seal inspection | Quarterly | Observed checklist |
| Supervisor | KPI review and audit | Monthly | Data review sign-off |
Training program essentials
- Hands-on coaching at the station, not classroom-only instruction
- Measured sign-offs: the trainer observes the operator performing the task, not just explaining it
- Retraining triggers tied to KPI drift: if rework rate climbs above the baseline by more than 10%, trigger a re-audit and retraining for the affected station
- Short daily checks (5 minutes at shift start) to reinforce critical habits
Pro Tip: Tie one KPI to each operator’s daily sign-off sheet. When operators record their own transfer-efficiency proxy or rework count, they notice drift before supervisors do.
What does the research say about expected improvements?
The evidence for audit-first, targeted interventions is consistent across academic and vendor sources.
The PLOS ONE VSM study in an automotive painting context showed that structured process mapping and ECRS-style changes produced measurable increases in value-added time and reductions in waste, including scrap and exhaust purification improvements. VSM is not a theoretical exercise; it produces a prioritized action list with before-and-after metrics you can defend to leadership.
The Springer AGV simulation found that deck-lift AGVs in dedicated painting workstations reduced waiting time and lead time in modeled configurations. The caveat is important: these gains depend heavily on line layout and part-flow characteristics. AGVs are a meaningful lever for high-volume, low-variance lines, not a universal fix.
The Graco ProMix PD case study documents a finisher moving from pressure-pot mixing to a three-component positive-displacement system, with reported monthly material savings and a multi-month payback. The specific numbers vary by facility, but the structure of the savings is consistent: less flush waste, fewer rejects, and faster color changes.
Optimization area benchmarks
| Area | Expected savings / quality impact | Implementation complexity | Quality impact |
|---|---|---|---|
| Proportioning (plural-component) | Material and solvent waste reduction; faster color changes | Medium (1–3 days downtime) | Fewer off-ratio rejects |
| Gun setup standardization | Transfer efficiency gains; lower overspray | Low (hours, no downtime) | More consistent film build |
| Booth maintenance program | Downtime reduction; fewer contamination rejects | Low (schedule change only) | Lower dust-related rework |
| Operator SOP and training | Technique variance reduction | Low (training time only) | Consistent application |
| Robotic / AGV automation | Lead time and waiting time reduction on high-volume lines | High (capital, programming) | High consistency on simple geometry |
Vendor evaluation questions for ProMix PD and ProMix 2KS
- What is the minimum and maximum ratio range for your coatings?
- What is the flush volume per color change with near-gun placement versus central mix room?
- What maintenance intervals and spare-parts inventory does the system require?
- Can the system log ratio data for quality records?
- What is the typical installation downtime for a retrofit on an existing line?
What does a 90-day implementation plan look like?
Convert audit findings into scheduled actions. The 90-day window is long enough to run a meaningful pilot and short enough to maintain momentum.
Weeks 1–2: Quick wins
- Update gun setup SOPs for all spray operators based on audit findings.
- Replace worn door seals and any filters at or past their pressure-drop limit.
- Standardize spare-parts inventory (filters, seals, fluid tips).
- Post updated SOPs at each station; conduct a 30-minute walkthrough with operators.
- Begin recording baseline KPIs daily: material per unit, rework rate, downtime minutes.
Weeks 3–8: Pilot phase
- Install and commission proportioner on the highest-volume color or line.
- Train operators on new proportioner SOPs with hands-on sign-offs.
- Run the pilot KPI tracking protocol (see Section 6 template).
- Address the top two bottlenecks identified in the VSM audit.
- Conduct a mid-pilot review at week 5: compare KPIs to baseline, adjust if needed.
Weeks 9–12: Evaluate and scale
- Calculate pilot ROI against the pre-defined go/no-go criteria.
- If criteria are met, prepare capital request for line-wide proportioner rollout.
- Schedule any deferred booth maintenance (conveyor inspection, wall cleaning).
- Update competency matrix and schedule next operator re-certification cycle.
- Document lessons learned and revise the audit checklist for the next cycle.
Pro Tip: Assign a single owner to the 90-day plan, not a committee. One person with authority to schedule downtime and move resources will outperform a cross-functional team with no clear decision-maker every time.
- Paste this timeline into your CMMS or maintenance planning system as a work order series.
- Review progress weekly at a 15-minute stand-up, not a monthly meeting.
The case for process-first, technology-second
Most optimization programs fail not because the technology is wrong but because the process underneath it is not ready. A robotic applicator on a line with inconsistent surface prep and no SOP for gun setup will deliver inconsistent results at high cost. The equipment gets blamed. The real problem was never addressed.
The highest ROI in most industrial painting operations comes from audits and process fixes first, then targeted technology. The Graco paint efficiency audit resource makes this point directly: gun setup, operator technique, and pump choice are the primary causes of transfer inefficiency, and most of them are correctable without capital expenditure.
Large-capex automation makes sense in a specific scenario: high-volume lines with low geometry variance, stable product mix, and documented process discipline already in place. It will make the variance more frequent and more expensive.
The single closing recommendation: run the audit, fix the process, then buy the equipment. In that order, every time. Facilities that invert this sequence spend more and improve less.
Dustfreefilm fits directly into your booth-contamination reduction plan
Dust contamination during changeovers and maintenance periods is one of the most consistent sources of finish rejects in industrial spray booths. Wall and floor surfaces that accumulate overspray become contamination sources the moment airflow is disrupted, a door opens, or a maintenance crew enters the booth.
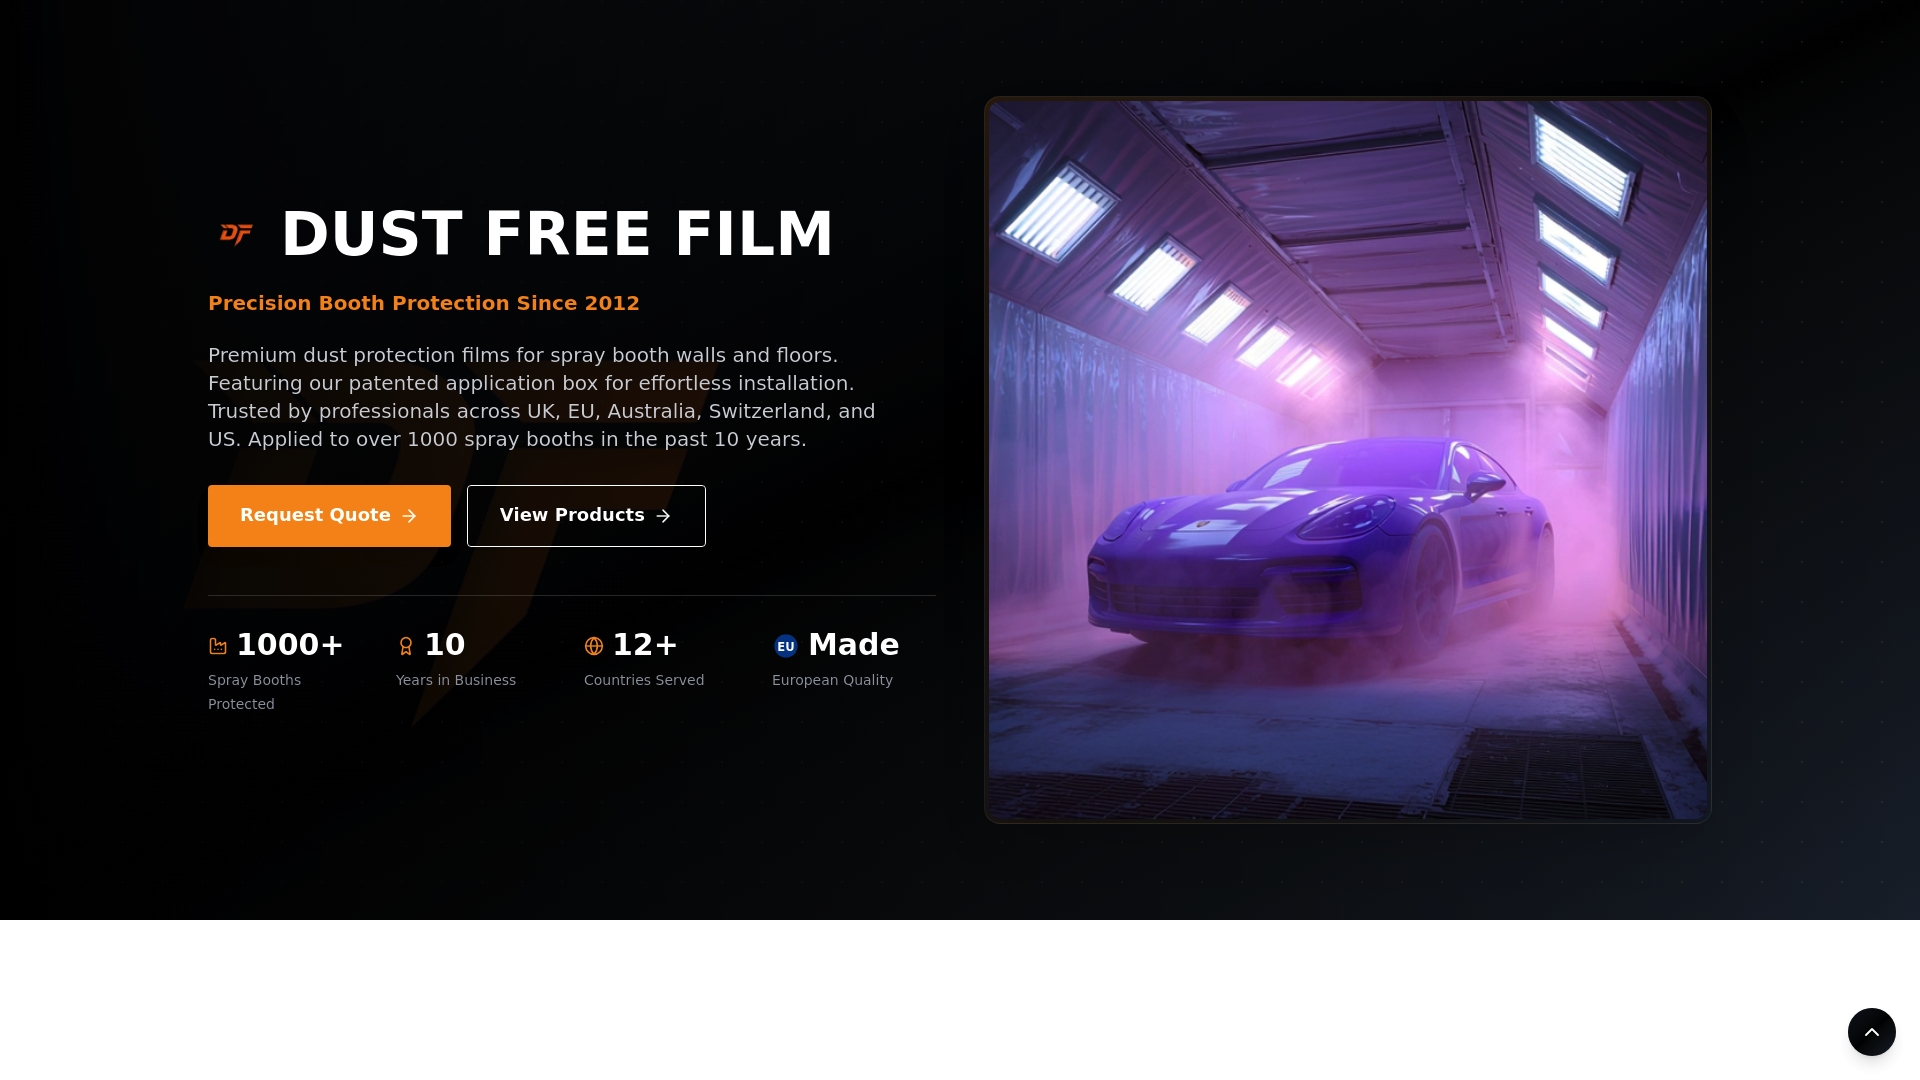
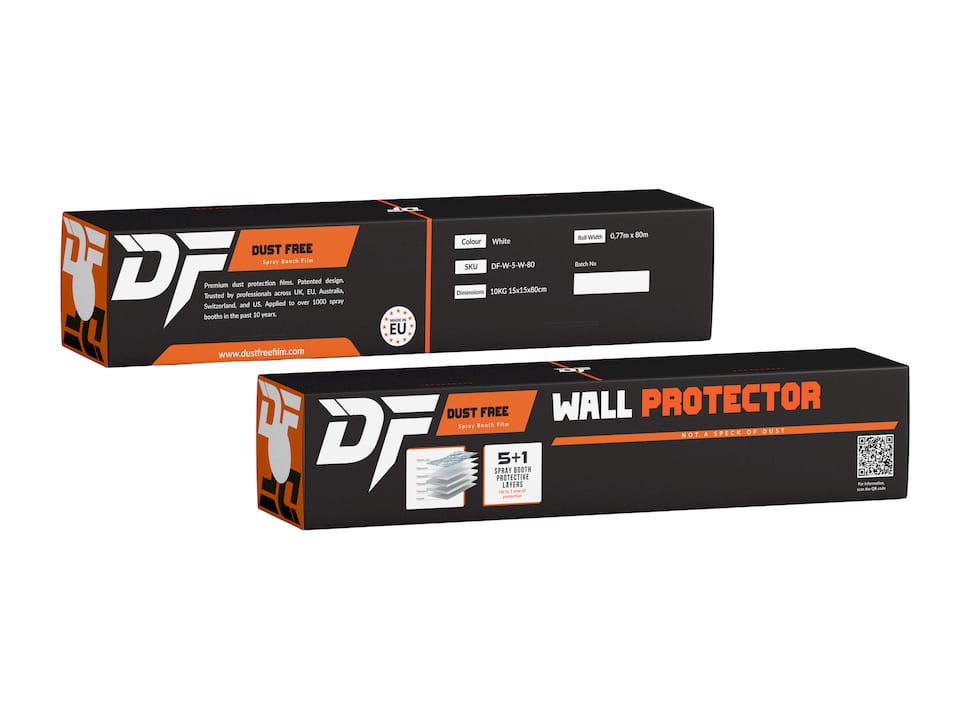
Dustfreefilm’s multi-layer electrostatic booth wall and floor protection films address this at the source. The films install without tape using a patented dispenser system, adhere electrostatically to booth surfaces, and peel away cleanly during changeovers, taking the accumulated overspray with them. Heat-resistant and static-free, they are built for the thermal and chemical conditions of active industrial booths.
Include Dustfreefilm products in your pilot plan: measure dust-related reject rates before and after installation, and track booth turnover time during changeovers. The reduction in contamination-related rework is a direct, measurable line item in your ROI model.
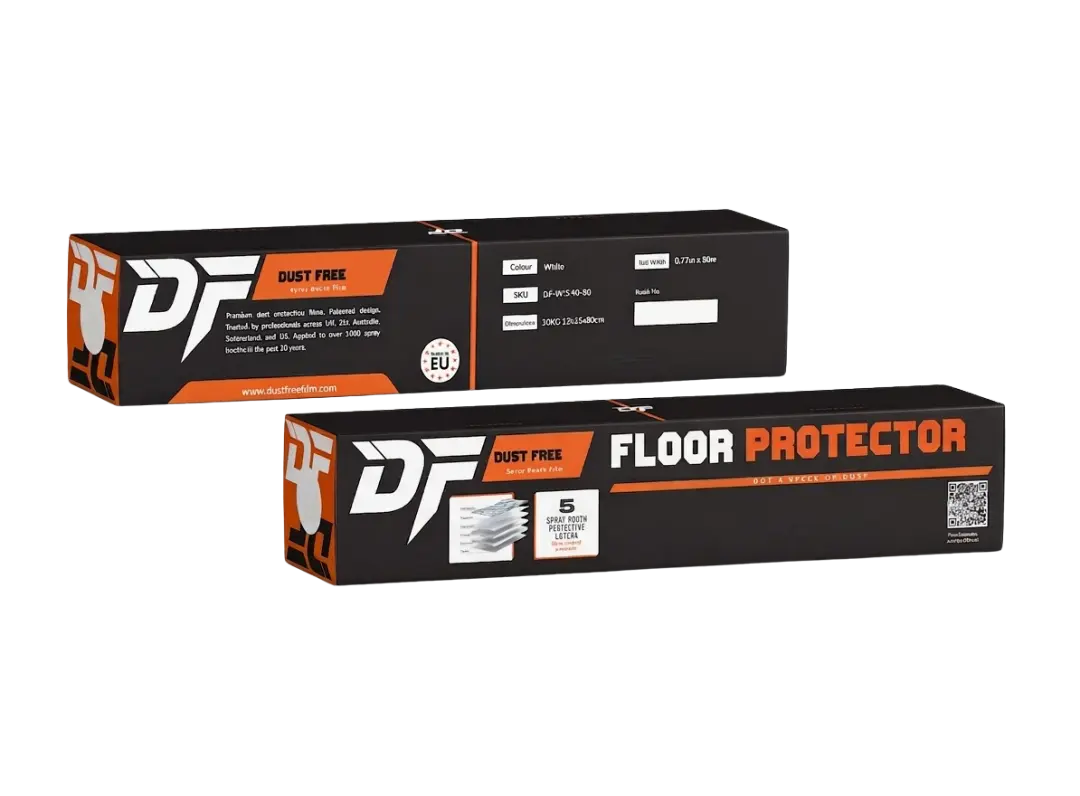
Browse the full range of spray booth protection products or request a quote for bulk orders and custom configurations.
Sources
The sources below back the claims in this article and provide deeper reference material for audit methods, proportioning ROI, application standards, and automation research.
Academic and standards sources
- PLOS ONE — Value stream mapping and digital transformation in automotive painting
Vendor case studies and ROI tools